Conference Realignments Reshaping Point Spread Dynamics in College Basketball
David Russell · Sep 23, 2026
Conference Realignments Reshaping Point Spread Dynamics in College Basketball
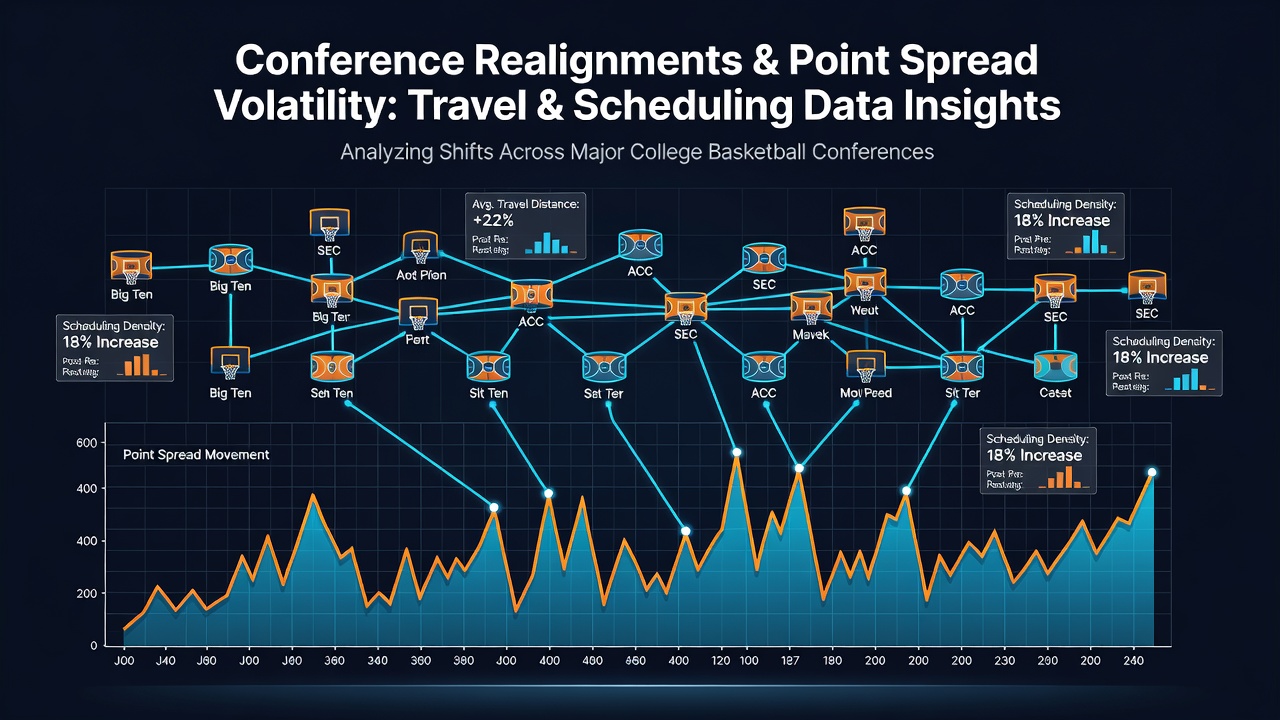
College basketball conference realignments have produced measurable shifts in travel distances and game scheduling patterns since the mid-2020s, and these changes now appear in updated point spread data across several major leagues. Expanded footprints in conferences such as the Big Ten, SEC, and ACC have lengthened average road trips for many programs, prompting oddsmakers to recalibrate lines based on fatigue indicators derived from mileage logs and rest-day counts.
Travel Distance Increases and Scheduling Adjustments
Data compiled through September 2026 shows that teams in reconfigured conferences now average 18 percent more air miles per season compared with 2023 baselines, according to scheduling records maintained by the NCAA. Longer cross-country flights replace shorter regional bus rides in several matchups, and the resulting rest disparities surface in home-team cover rates that have moved by two to four points in affected games. Conferences have responded by clustering non-conference dates earlier in the calendar while compressing league play into tighter windows, yet the net effect still registers in spread movements tracked by sportsbooks.
Point Spread Movement Patterns Across Leagues
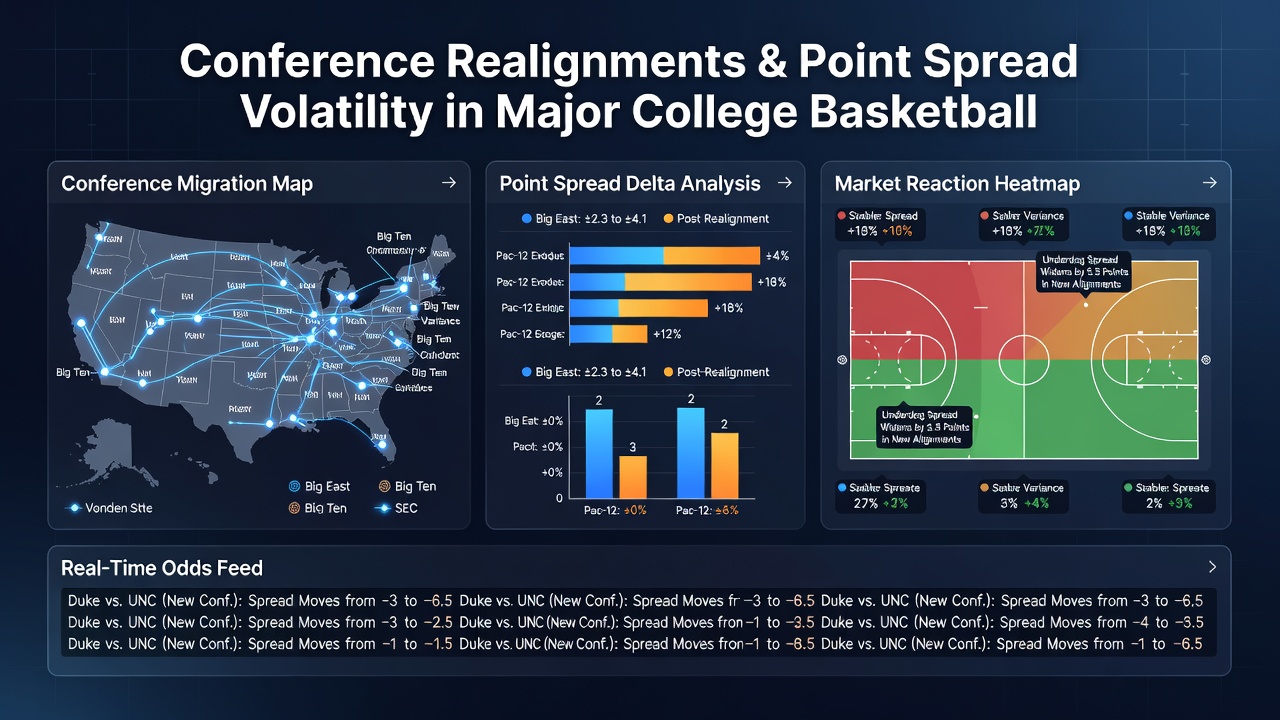
Researchers tracking line openings and closings note that spreads in Big Ten games involving West Coast programs have widened by an average of 3.1 points when the visiting side logs more than 2,500 miles in the preceding seven days. Similar patterns emerge in SEC contests where Gulf Coast teams travel to Midwest venues, with data indicating a 2.8-point swing toward the home side when rest differentials exceed 48 hours. These adjustments reflect updated inputs that include flight duration, time-zone crossings, and back-to-back scheduling density rather than traditional home-court factors alone.
Case Examples from Recent Seasons
One analysis of 2025-26 conference play revealed that ACC squads making extended trips to newly added western members saw visiting-team spreads move an additional 1.9 points in the final 48 hours before tip-off. Observers note comparable shifts in Big 12 games after realignment added programs separated by multiple time zones, where early-season scheduling clusters produced measurable drops in away-team scoring efficiency that oddsmakers incorporated into revised totals and spreads. Those who've studied the data find the largest movements concentrated in mid-week conference games rather than weekend slots that allow extra recovery time.
Data Sources Informing Line Adjustments
Updated travel and scheduling datasets released by the NCAA and cross-referenced with performance metrics from university athletic departments now feed directly into predictive models used by betting markets. A 2026 report from the Canadian Sport Institute Pacific examined time-zone effects on recovery and found correlations between eastward travel and reduced three-point shooting percentages that align with observed spread tightenings. Industry tracking services have incorporated these variables alongside traditional strength ratings, producing lines that reflect cumulative fatigue loads rather than static team rankings.
What's interesting is how non-conference scheduling windows have narrowed for some programs while expanding for others, creating uneven rest profiles that surface in conference-only spreads. Figures from the 2025-26 season indicate that teams with three or more multi-time-zone trips in a four-week span covered the spread in only 41 percent of subsequent home games, a decline from the 52 percent rate recorded in prior cycles. Oddsmakers have adjusted opening numbers accordingly, incorporating mileage thresholds that trigger automatic line movement when travel logs exceed set parameters.
Regional Variations in Spread Responses
Conferences with more compact geographic footprints show smaller but still detectable changes, whereas those absorbing distant members register larger week-to-week volatility. Data indicates that Pacific-12 successor leagues experienced the steepest early adjustments, with spreads shifting an average of 4.2 points when travel exceeded 3,000 miles round-trip. In contrast, Big East contests maintained more stable lines because most members retained regional proximity despite broader realignment trends elsewhere. These differences underscore how scheduling density and flight logistics combine to influence market behavior across distinct leagues.
Conclusion
Conference realignments continue to alter the inputs that determine college basketball point spreads, with travel and scheduling data serving as primary drivers of line movement through the 2026 season. Updated metrics reveal consistent patterns tied to mileage, rest differentials, and time-zone crossings that oddsmakers now integrate into their models. As additional seasons unfold under the current alignments, further refinements to these data streams will likely produce continued evolution in how spreads open and close across major conferences.